
 Observe
 Accelerate
 Troubleshoot


About Criteo
Criteo (NASDAQ: CRTO) is a publicly-traded online advertising provider valued at over $2 billion and headquartered in Paris, France. Its industry leading Commerce Media Platform connects thousands of marketers and media owners to deliver richer consumer experiences from product discovery to purchase.
We spoke with Emmanuel Guerin (Staff DevOps Engineer) and Loïc Teikiteetini-Vaysse (Staff DevOps Engineer) at Criteo to understand how Develocity is changing the way their development teams troubleshoot, observe, and quickly report build issues.
Criteo has over 3500 employees on 5 continents
Describe your team’s role and your responsibilities to the broader Criteo development organization
Our team is responsible for managing continuous integration for the majority of development projects in our company. Our primary goal is to standardize a solution implementation that properly attributes versions to all modules in our repositories, and handles the dependencies between modules of different repositories.
In that sense, we’re one of the drivers of the developer productivity and developer experience journey at Criteo and we aim to provide a simple-to-use and unified experience across the different environments and technologies we support. We do this by tracking DPE metrics like time-to-resolution for build and test failures as well as uncovering the root cause of complex dependency management issues.
Describe your overall development, build and test environment so we can understand your Develocity deployment in context
Criteo’s hundreds of software engineers take a polyglot approach to programming, using Java as well as .NET, Python, Go, and other languages. The overall team works with about 1,000 repositories and builds 6,000 projects around 20 times a day.
This is represented by about 13,000 daily CI builds (which equates to 60 days’ worth of builds each day) and local developers running about 2,500 builds per day.
For our Java CI workloads, we switched from Apache Maven to Gradle a couple of years ago because we were looking for a tool that could help us:
- Monitor build activity
- Quickly compare builds
- Debug dependency resolution
Since then, both local and CI developer environments have been using the combination of the Gradle CLI and Develocity™ as the main UI for our users. Develocity Build Scan® has been our main reporting tool—no more struggling with hundreds of pages of Jenkins logs and noisy test reports that prevented us from finding the root cause of a failure quickly.
Develocity gives us the metrics we need with very little effort and helps us understand the impact of our work on the overall system.
What developer productivity challenges or pain points have you addressed with Develocity?
We have multiple tech stacks to support, and it’s important that we maintain the same level of service for each stack’s lifecycle, performance, reporting, etc.
Working in this sort of heterogeneous environment—where both CI and local builds are constantly running—is a challenge, especially when it comes to detecting problems specific to particular environments.
For example, we use tagging to track random errors when uploading different artifacts filters. Recently we noticed a lack of stability in this process. By using the Develocity Failure Analytics dashboard to drill down into these tags, we discovered that the culprit was a single artifact filter causing the problems. This would have been impossible without Develocity.
We also discovered the immense advantage of publishing every local build as a Build Scan in order to better support our users. It helps us monitor the usage of different features locally, and rapidly resolve any problems they have.
For example, troubleshooting build errors used to take 5-10 minutes in the past, and now it’s a matter of seconds with the data provided by Build Scan. This also helps with complex issues involving transitive dependencies and other dependency management challenges.
So, the first thing our users usually hear from us is “Send us your Build Scan URL” if they haven’t already learned to provide it.
Describe how you use Develocity Build Scan and Failure Analytics

“Dependency resolution between artifacts is really clear to us with Build Scan. We are better equipped to handle these issues because we don’t need to start from scratch—it used to take us up to 30 min to compare dependencies, but now we can just compare the latest build with the last successful build and immediately see which dependencies have changed.”
Loïc Teikiteetini-Vaysse – Staff DevOps Engineer
Build Scan
We use Develocity Build Scan as our main reporting system. Users are presented directly with scan URLs in their pull requests (instead of CI job URLs), which allows them to find the source of failures more easily. We’ve also implemented a Gradle plugin that allows developers to declare generated files as extra reports that will get published in the Build Scan for more information on specific tasks.
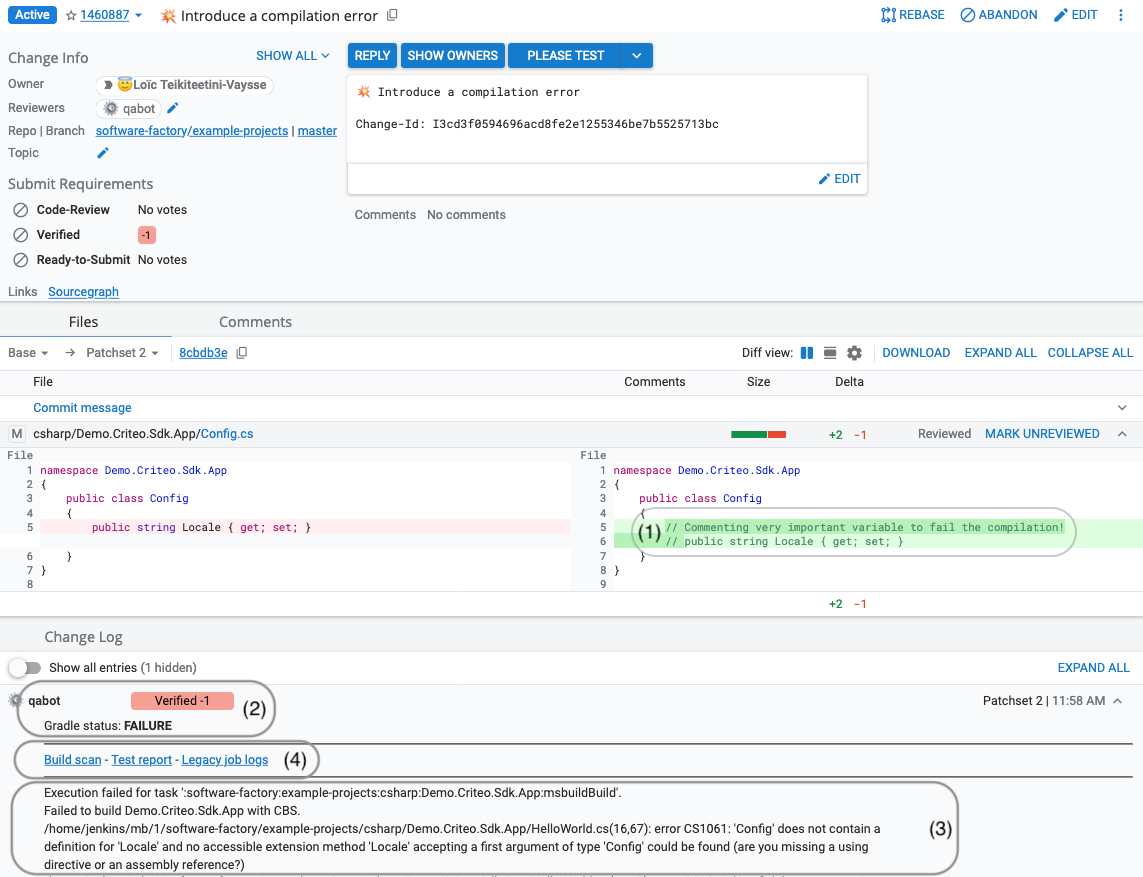
Build Scan is the favored entry point for reading and understanding any CI build. In the image above, we can see (1) a compilation error, (2) the CI validation failed, (3) a short preview of failures is displayed in the feedback message, (4) shortcuts to build scan summary and test reports also in Build Scan are pointed out for the user to get a more detailed view.
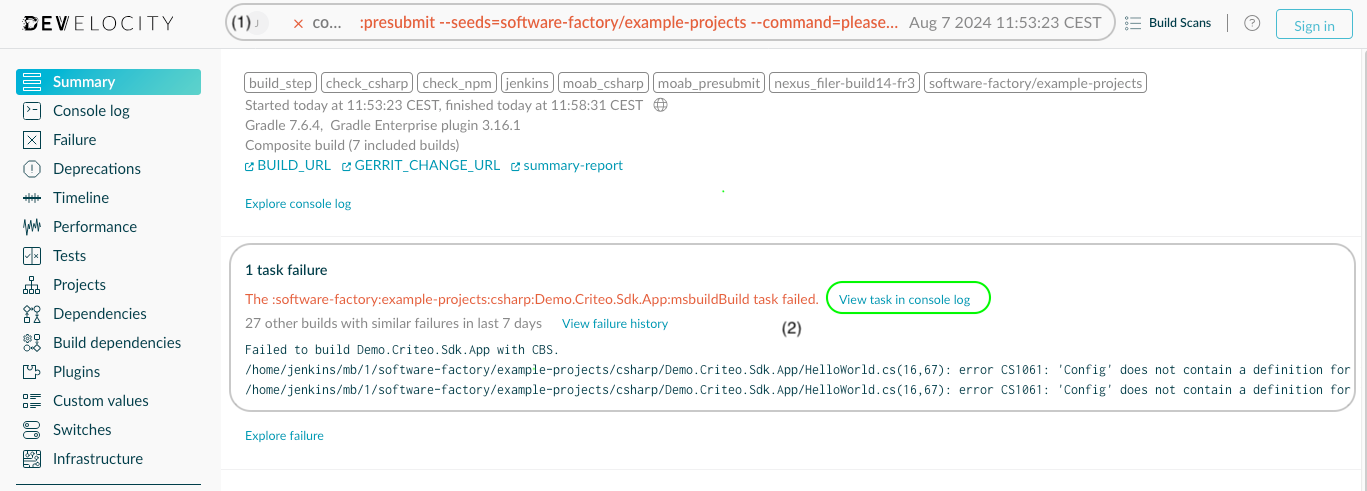
The Build Scan summary gives our users a concise overview of how the build performed. In the image above, we see (1) where the build failed, and (2) one failure is listed with the failure preview. From there we can access the failed task console output.
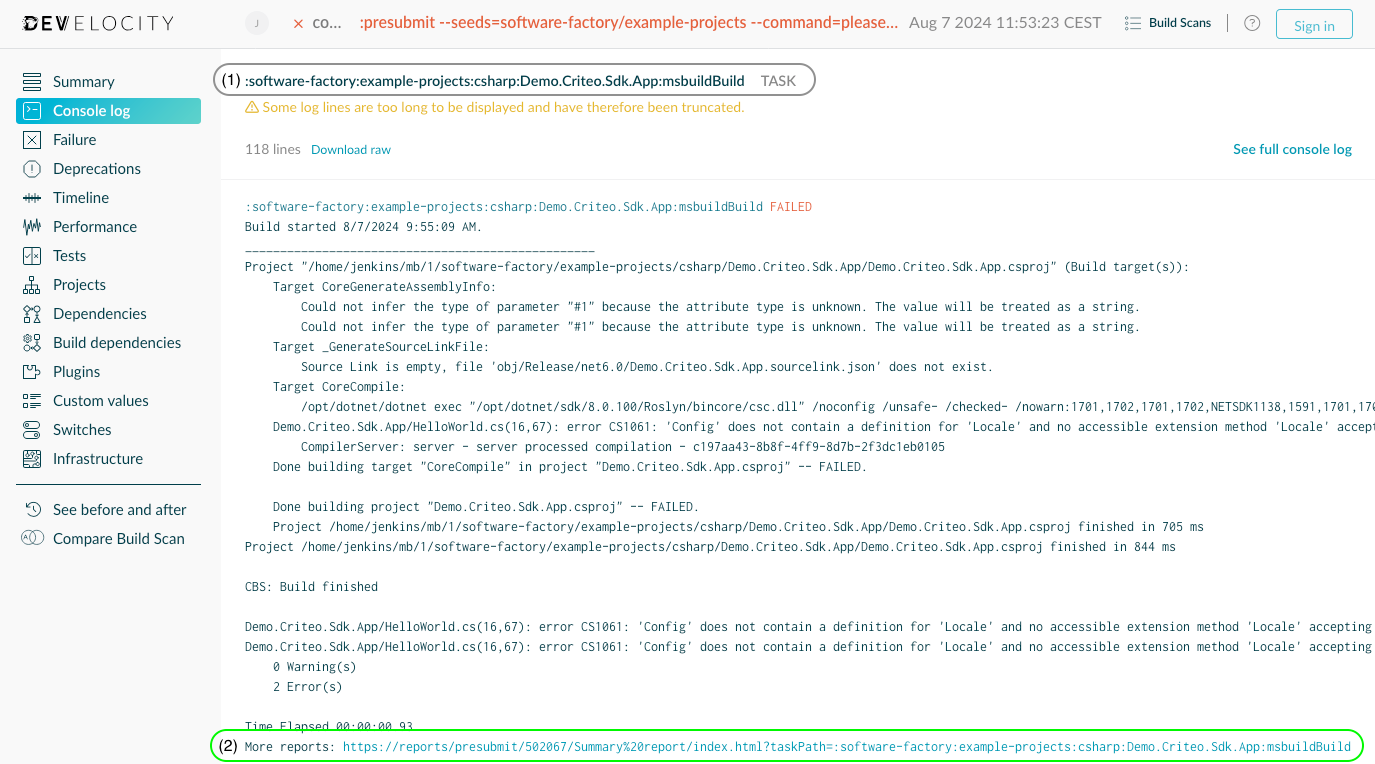
Looking at the (1) task console log in the image above allows our users to filter the full build console log to only display the logs that belong to the task execution. Users can bind (2) additional reports from their build scripts.
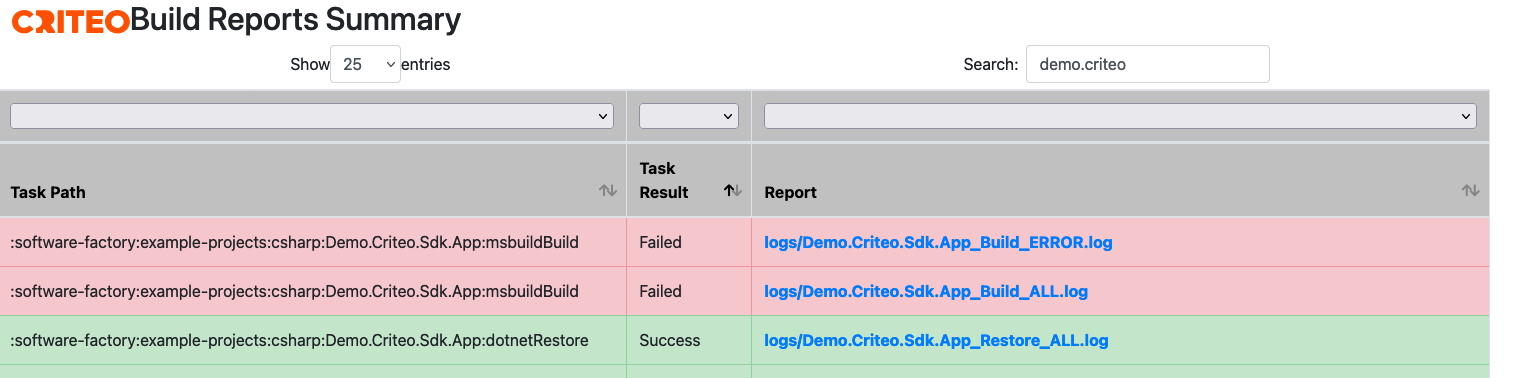
The image below shows an example of how complementary reports are displayed to our users.
Failure Analytics
Develocity Failure Analytics is an invaluable tool for following a particular type of error, its origins, and the different parameters that can make it reproducible (operating system, repository, JVM version, etc.) This requires carefully choosing which tags and custom values we put on our scans to improve error reporting in our Gradle builds in order to get the maximum benefit of the feature.
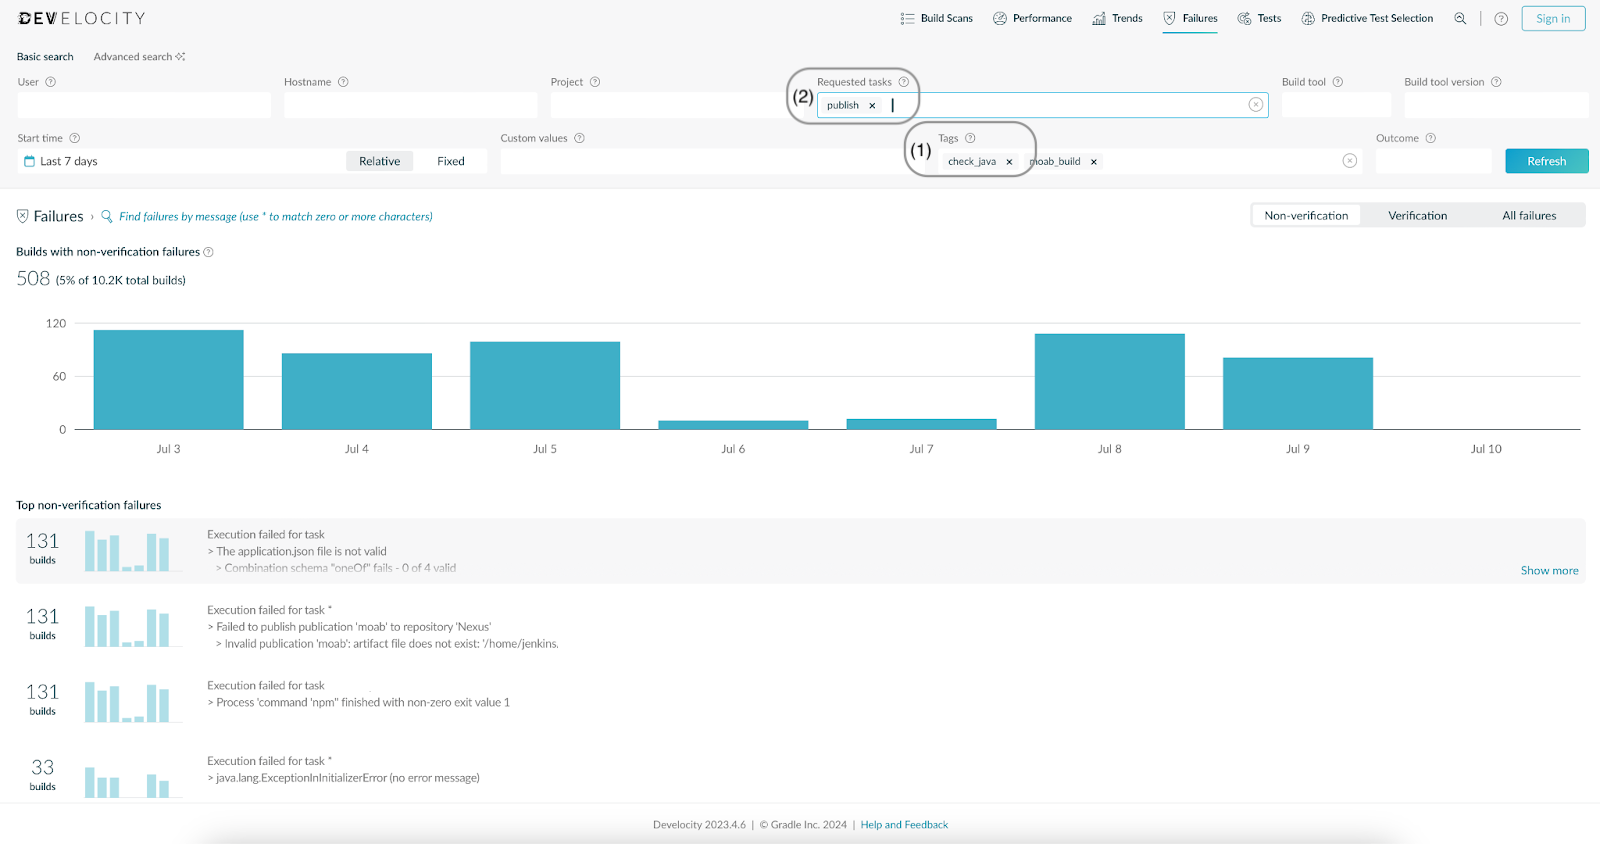
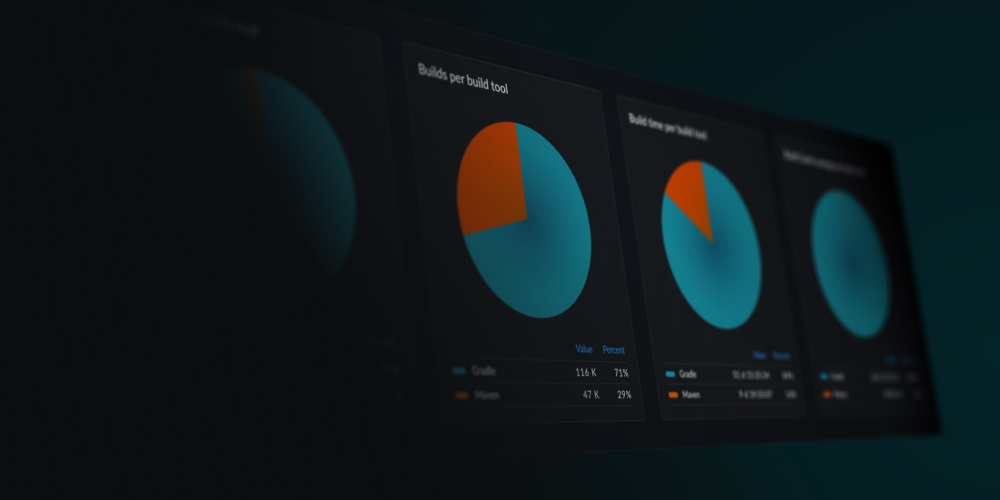
Using Failure Analytics, we can list failures with the largest impact. In the image above, we use tags to focus on the most impactful failures for (1) JVM projects when (2) attempting to publish.
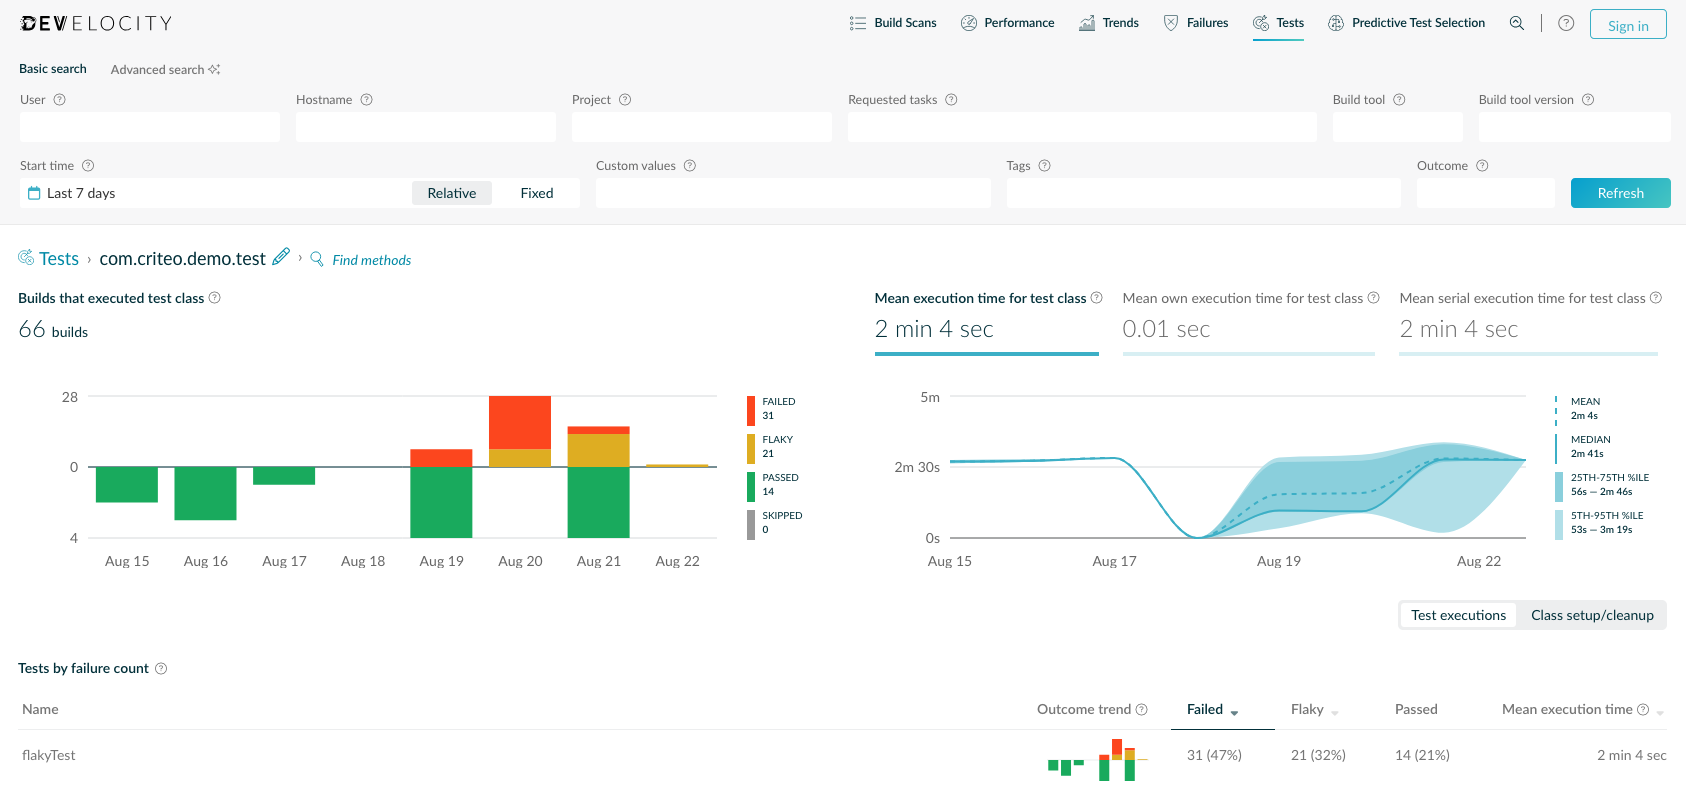
Similarly, Develocity’s Test Failure Analytics dashboard shown above allows our users to follow how one or more tests perform over time. This includes performance and can also instruct us on potential flakiness.
Describe your overall experience with Develocity and some of your top lessons learned

“We have very little trouble maintaining Develocity: it just works and is stable, and upgrades are usually entirely painless with minimal downtime.”
Emmanuel Guerin – Staff DevOps Engineer
As a service provider team responsible for the overall health of a large and complex build environment, Develocity is a breath of fresh air. We can quickly analyze and help resolve the build challenges our developers face on a daily basis.
Develocity is very, very easy to install as a standalone server—just following the administration documentation gets you up and running in no time. We have also integrated the Helm chart quite easily into our Chef-based configuration management system. This allows us to bootstrap a new instance of Develocity in minutes.
Here are some tips we can offer other development teams just getting started, based on our own lessons learned:
-
Provision your environment properly. Make sure that you have the proper hardware to support your Develocity use case, namely disk performance, when publishing thousands of Build Scans per day.
-
To get the most out of Build Scan, take the time to set appropriate Tags, Custom Values, and meaningful Gradle exception messages for failure analysis. This will save you headaches down the road.
What future plans do you have for Develocity?
In terms of what’s next for our team, we plan to improve our caching system at the job level, onboard more technologies into the JUnit import mechanism for test result analysis, and discover new reporting possibilities with the Develocity Reporting Kit (part of Develocity Reporting & Visualization).