
 Accelerate
 Troubleshoot
 Observe


If you’re a regular Apache Maven™ user, you know that build times can quickly add up, eating into your development time and slowing down your feedback loop—whether you’re waiting for a local build to finish or watching a pull request inch towards merge, every minute counts.
In this post, I’ll discuss five low-effort strategies for accelerating your Maven builds, showing a real-life example that brings a 1.5-minute build down to 7.5 seconds. These tips will help you return to what you love most—writing code!
I’ll use the Apache SCIMple project as a representative Maven project to demonstrate these techniques. SCIMple boasts around 20,000 lines of Java code, multiple modules, and a full suite of unit and integration tests.
Feel free to follow along with SCIMple by cloning the slow-build branch:
Note: This branch is intentionally unoptimized to showcase the impact of our speed-up techniques.
Measure before you optimize
The only way to know if something is improved or… simply what needs to be improved is to measure it, so before discussing optimizations, let’s measure the baseline build time. To do this, we could manually parse console logs, but a Build Scan® is more efficient and it will record the history of the changes.
A Build Scan offers a treasure trove of information about your build, including dependency download times, plugin usage, and system details. You can also easily share these insights with your team—every line in a Build Scan has a shareable URL, so your teammates can navigate directly to the data you want to discuss.
To get started, add the Develocity Maven Extension to your project and run a standard build:
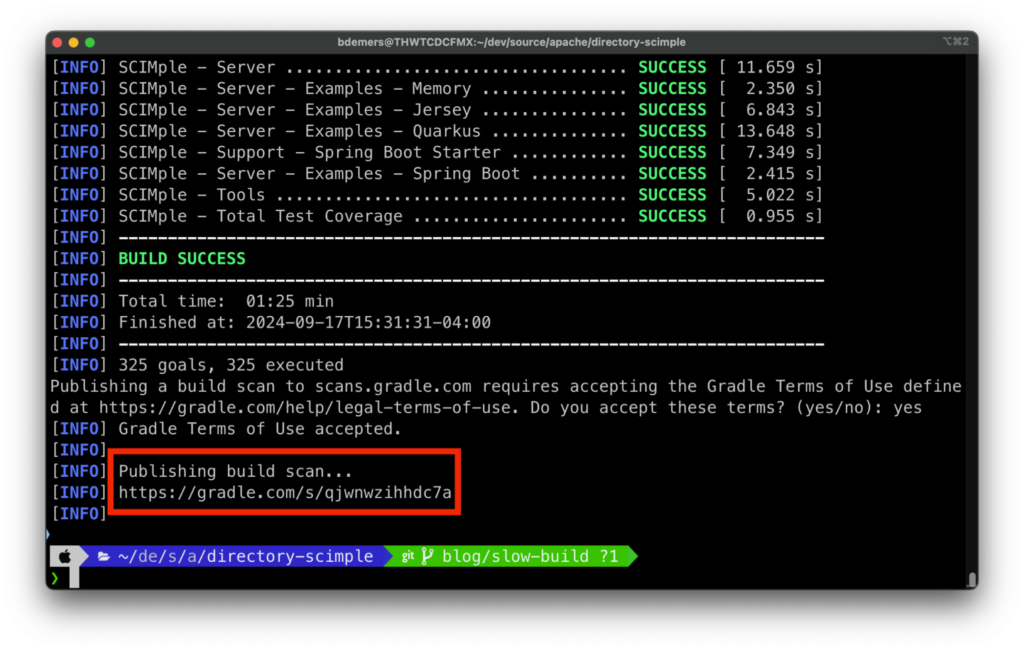
This build took about 1.5 minutes; that’s the starting point. If you work on a large project, it probably takes much longer, but if I used a 20-minute build for this blog post, you probably wouldn’t want to follow along!
Remember, you run through these same steps with any Maven build. After the build is complete, you’ll see a link to a Build Scan in the console output:
Open it up and look at the timeline view. I always look at the timeline first because it’s particularly helpful for identifying bottlenecks.
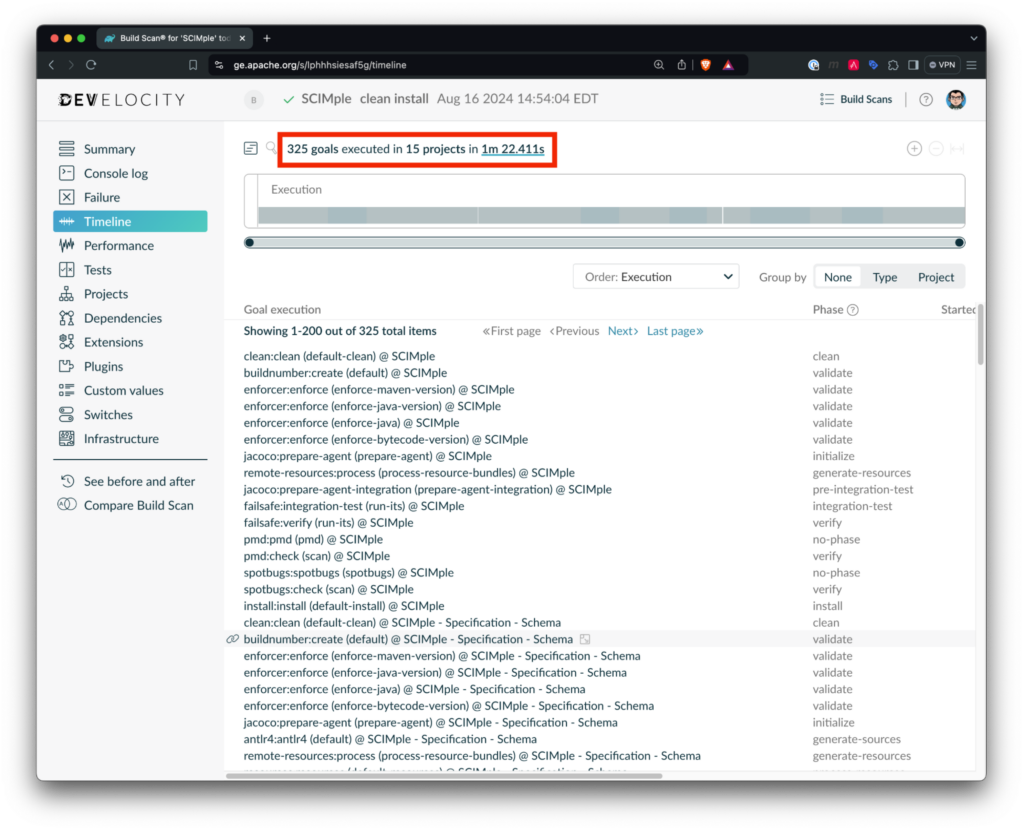
I can glance at the timeline to see which bars are the longest. If I want to see which goals take the longest, then I group by type, and I can see that SpotBugs takes the longest to run, followed by the integration tests (Failsafe), unit tests (Surefire), PMD, and then compilation.
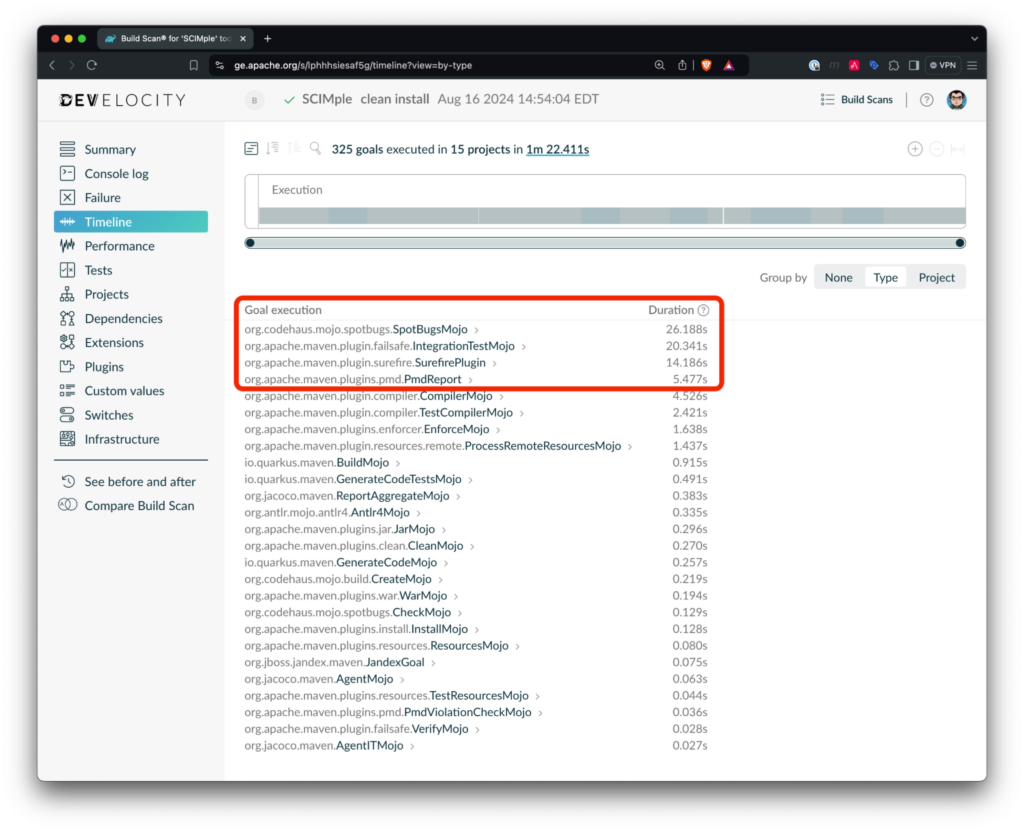
I love SpotBugs, and its Find Security Bugs integration. SpotBugs has a great IntelliJ plugin, and since I started using it, it’s taught me a lot about writing better and more secure code. I highly recommend it!
That said, I don’t want the SpotBugs Maven Plugin slowing me down. I’m not always interested in the plugin’s results for local builds (I get that data as I type in my IDE). Most of the time, with local builds, I just want to see if my tests pass. The same goes for other static analysis tools like PMD or other linters. These goals can be split out of the default build by using profiles.
1. Profile power
First up are Maven profiles. A profile allows you to segment off parts of your build and they can be activated conditionally or manually on the command line using a -P<profile_name> argument.
Let’s move our static analysis tools (like SpotBugs and PMD) into a dedicated profile. This way, they run only when needed (e.g., in CI or before creating a pull request), significantly reducing our default build time.
To create a profile, add the following to your POM:
If I run mvn clean install again, I can see the build now takes about a minute!
We can do more, though!
I’ll open up the new Build Scan, go back to the timeline, and Group by type again:
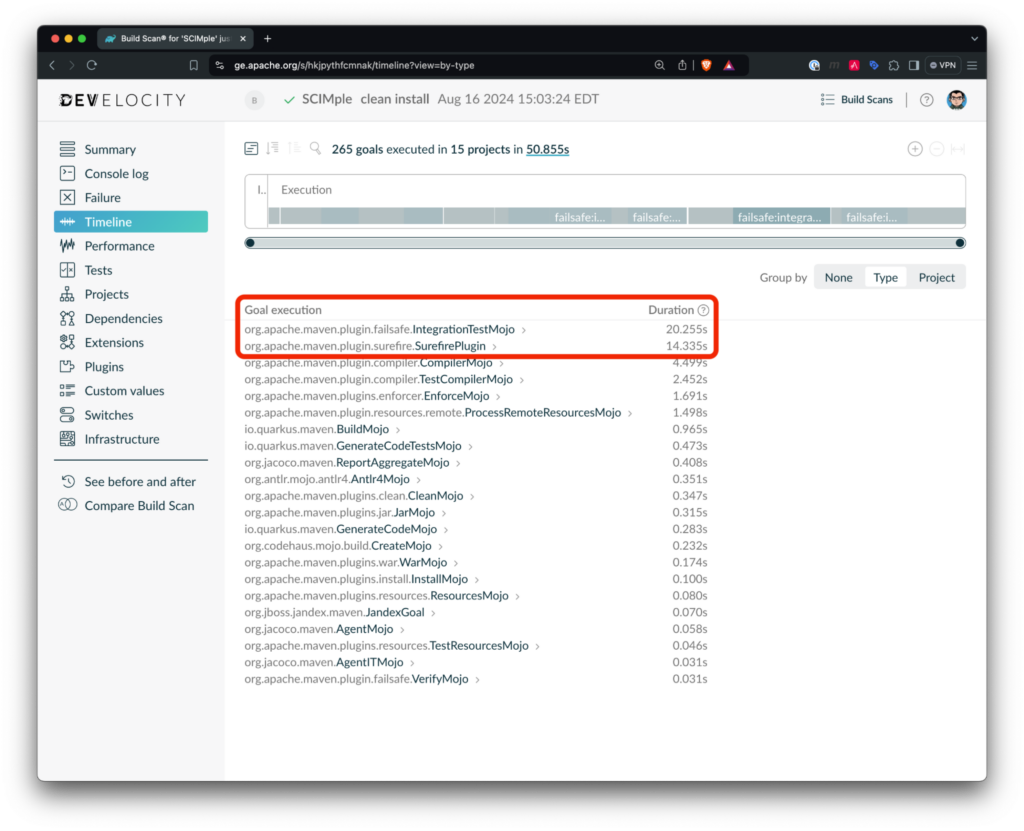
This looks better: now most of the time is spent running tests, and we can optimize that too!
2. Concurrent tests
Similar to running the modules of the build in parallel, tests can be run in parallel, too. There is a lot of potential to speed up your builds this way. The Maven Surefire Plugin (and Failsafe Plugins) provide a lot of options to run your build in parallel. It offers so many, it might be overwhelming, so I’ll narrow it down to two options to explore.
You can run tests sequentially on multiple JVMs using the forkCount option; this represents the number of JVMs that will be used concurrently to run your tests. Forking multiple JVMs is an excellent option if your test code depends on the state of static fields, singletons, or other JVM-wide settings like setting system properties.
Alternatively, you can concurrently run tests in a single JVM using multiple threads. When running tests on multiple threads, you can configure the level of granularity at which the tests should run in parallel. You can also run multiple test classes at the same time and have the individual methods run sequentially or concurrently.
You can also combine the forking and threaded options, forking multiple JVMs, each running tests with multiple threads.
Okay, so let’s break this down:
- Use
forkCountif you have tests that depend on JVM-wide state (static fields, singletons, setting system properties, etc.) - Run your tests on multiple threads if you have been practicing good test isolation practices (your tests don’t hard code file paths or ports, or don’t depend on external infrastructure that is not orchestrated through your tests (e.g., Testcontainers)
If you use JUnit 5, I’d recommend configuring the parallel run options through JUnit properties; otherwise, use Surefire’s parallel and threadCount parameters.
NOTE: JUnit 5 also has annotations to mark tests as NOT thread-safe. If not all of your tests can run in parallel, you can run those offenders separately using the Isolated or the ResourceLock annotations.
You can also run your tests remotely with Develocity’s Test Distribution feature, which stops your laptop or CI agent from being the bottleneck for your tests.
To enable parallel testing for Apache SCIMple, you can set the JUnit 5 properties in both the Surefire and Failsafe plugins, similar to this:
NOTE: At the time of this writing, Quarkus does not support the above configuration. The Apache SCIMple Quarkus tests are each annotated with @Isolated, forcing those tests to run sequentially.
Re-running the build again (mvn clean install) reduces the build time to 46 seconds! We are really making a dent in the build time!
3. Unleash parallel builds
Your machine likely has multiple cores; mine has 10, but by default, Maven will only build one module at a time. Let’s change that!
Create a .mvn/maven.config file and add:
This instructs Maven to build multiple sub-modules at once to 1.5 times the number of cores (C) your machine has; on a 10-core machine, Maven would build up to 15 sub-modules at once, unlocking a substantial performance boost.
Rerunning the build: mvn clean install, we can see the build is down to 31 seconds!
Better, but let’s keep going!
4. Skip install (when possible)
The install goal may not seem like a significant bottleneck, but in large projects, skipping it when building uber-jars or large war files can save precious seconds.
If you frequently use the -rf flag to resume failed builds, you might need to run install to leverage changes in your project.
During a Maven build, plugin goals are run during phases of the build; the primary phases are validate, compile, test, package, verify, install, and deploy. So, to skip running the install, you just need to run the previous phase: verify.
If we run the Apache SCIMple build with mvn clean verify, only a few milliseconds will be saved. However, your mileage will vary here; you might save more time with a slower hard drive or file system. And remember, “installing” will copy files from your target directory to your local Maven repository (~/.m2/repository), which will also take up disk space.
5. Say goodbye to clean (sometimes)
While clean may seem harmless, it forces every goal to run from scratch, negating any benefits for plugins that support incremental changes. In most cases, you can safely skip the clean and shave off for a few more seconds.
Important Considerations:
- Some third-party plugins may not handle non-clean builds gracefully.
- You’ll need to run
cleanto populate the build cache, which we’ll discuss next.
On my laptop, skipping the clean by running mvn verify shaved a couple of seconds from the build. Again, the results may vary depending on the size of your project, the plugins you are using, and the type of hard drive/file system used.
Bonus: Build Cache magic
The Develocity Maven Extension also offers a build cache that reuses the output of previously run goals. This can drastically reduce build times, especially when you haven’t made code changes.
If you have been following along with the post, you will need to re-enable build caching:
unset MAVEN_OPTS
To populate the cache, run a clean build:
mvn clean verify
Subsequent builds will be lightning-fast; let’s put that to the test and run the build again
mvn clean verify
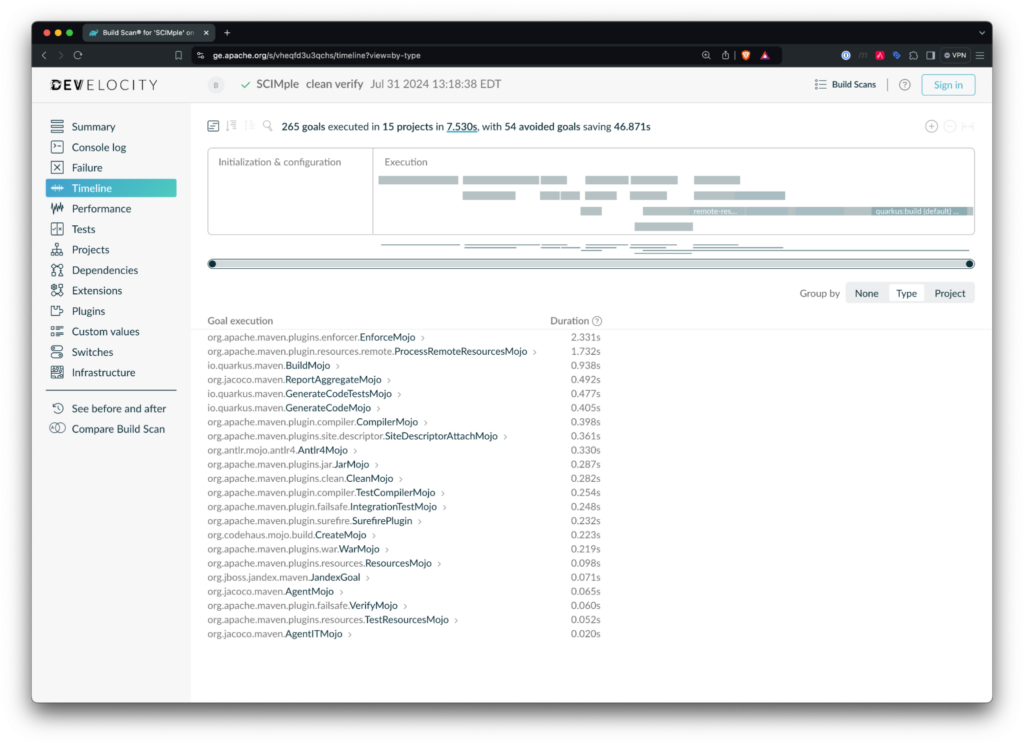
A fully cached build is now 7.5 seconds!
As you make changes and re-run builds, the full build will not be cached, but using a build cache coupled with the above tips will make your builds much faster!
If you want to learn more about build caching, sign up for the free Maven Build Cache Deep Dive course at DPE University.
Learn more about speeding up Maven builds
Using a combination of the techniques above, the Apache SCIMple build was reduced from roughly a minute and a half to eight seconds. Expect to save even more time on larger projects! Try out these steps on your favorite project, and let us know your results.
In addition to the above tips, there are a handful of other things you may want to look into:
- Inspect your CI build configurations – It’s common for projects to run multiple Maven invocations sequentially. Instead, you can combine them into a single Maven execution or run each command in parallel.
- Use the Maven Daemon – The Maven Daemon keeps a Maven process running in the background; each time you start a build, a super fast natively compiled GraalVM binary sends a message to the Maven Daemon to run your requested build. And it automatically runs your build in parallel.
- Keep Maven up to date – Maven has made many performance improvements over the years. Keep the Maven version and plugins updated!
- Run individual tests in your IDE – I’ve seen many cases where you could edit your code in an IDE, but you had to run a full Maven build to get the tests to run correctly. This adds toil to development, and that toil is increased when you want to debug one of your tests. Ideally, it should be a single click to run the test you are working on.
- Cache your dependencies on CI – Enable caching of your dependencies on your CI server. By default, your CI server may start with a clean
~/.m2/repositorydirectory, so each build needs to download all your dependencies and plugins. Caching may speed this up!
NOTE: If you’re caching your local Maven repository, be sure to take the advice above about using verify instead of install. (You don’t want to pollute the repository with old build output.)
These tips are just the first steps towards faster, more efficient Maven builds. But the journey doesn’t stop here! Make sure you continue to monitor your builds to avoid build time regressions. To learn more, check out these related resources:
- Build Rot: The Hidden Technical Debt in Maven and Gradle Builds
- Maven Dependency Hell: Five Tips to Get Out
- Free Maven Courses at the DPE University
For more great content, follow us on Twitter and LinkedIn or subscribe to our YouTube channel.