
 Observe
 Accelerate
 Troubleshoot


“Developers don’t know why CI or developer build times go up and they don’t always complain. Build times go up and down regularly and it’s hard to know why things happen that way.”
– Emmanuel Boudrant
How often do build performance regressions happen and what’s the impact on developer productivity?
The Netflix Android team says these regressions can happen often and sometimes significantly impact CI and local developer machine build times. Application or developer productivity teams would have to set up a monitoring and alerting system to identify these. For larger developer productivity teams, this becomes even more of a challenge since you have to monitor build performance, build cache health, etc., across many projects.
Fortunately, we have an app for that 😃
Develocity’s Build Validation Scripts and quick investigation Build Scan® links can help you identify build cache misses and use telemetry to measure the impact and prioritize the fix. Finally, you can use the Develocity UI to identify the solution to your performance regression.
Netflix now runs this process hourly and sends the notification to an internal Slack channel for alerting/monitoring. They also have the Build Scan telemetry to measure the build performance impact and prioritize accordingly. Keep reading to learn more about how Develocity can be leveraged to efficiently monitor build performance at scale.
In this blog post, we’ll cover:
- How Develocity’s Build Validation Scripts help customers like Netflix
- How we use Build Validation Scripts internally at Gradle to monitor over 2k OSS CI workflows
- How you can use Develocity to set this up for your projects (a deep technical tutorial)
How Netflix monitors and maintains build times
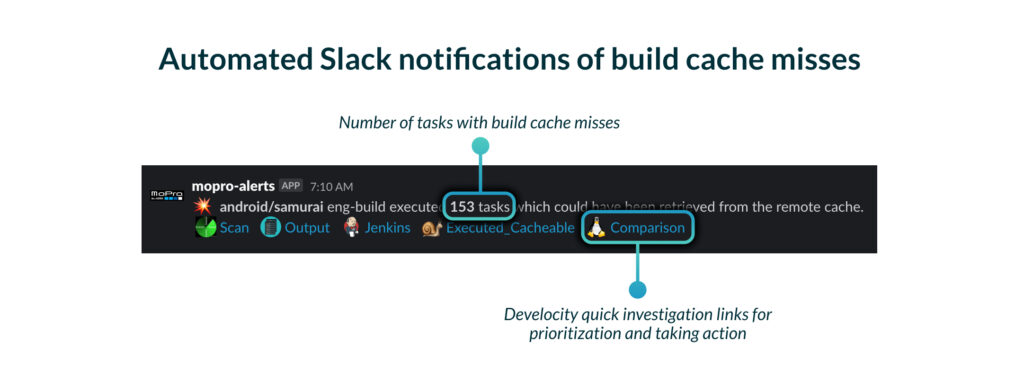
At Netflix, the Android team understands how build times can seriously impact developer productivity. To ensure efficiency, they’ve set up an hourly CI job that detects build-time regressions. When this job finds increased build times or cache misses, the system automatically sends a notification to the appropriate team’s Slack channel, along with details from the related Build Scan®.
Netflix has found a variety of build cache misses using this technique, including manifest files generated differently when using a Java version with a different minor version, a code generator that produced different output by Linux versus macOS, and when updating the version of Dagger (a Java injection framework). This system allows for quick identification of any issues, enabling the team to prioritize fixing regressions as soon as they’re detected. Netflix uses this approach to maintain optimal build times and streamline workflows to boost productivity.
How do you monitor build cache performance at scale?
Setting up build cache performance monitoring for one or two projects is one thing, but how can developer productivity teams achieve this across hundreds of source repositories?
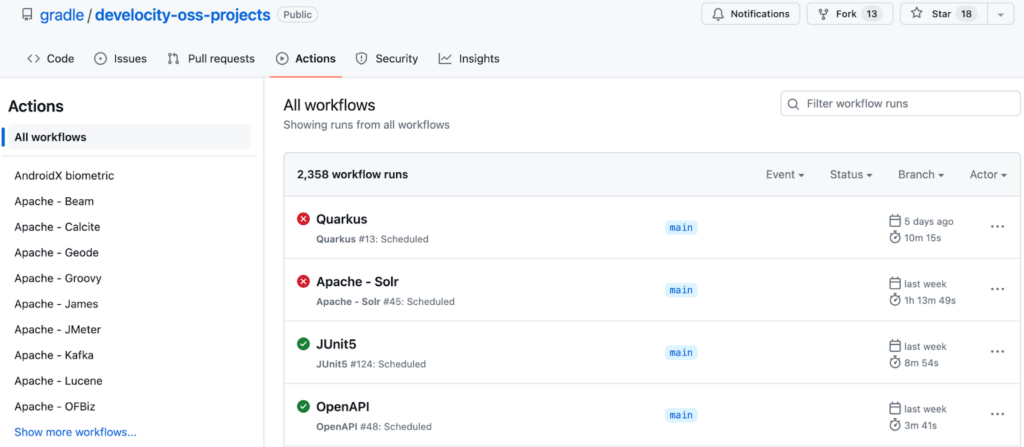
At Gradle, we employ build optimization best practices ourselves. Aside from assisting our customers in optimizing their own builds using the Build Validation Scripts, we implement recurring jobs exactly like those detailed in this blog post. These jobs validate both the Develocity builds and the builds of our OSS partners—including The Apache Software Foundation, Spring, and JetBrains, among others—across 2,300+ workflows.
For our OSS partner projects, these jobs are scheduled to run over the weekend. Come Monday morning, the Develocity Solutions team triages, assigns, and investigates any failures. If a build cache miss is detected, the CI job fails, which makes it easy for the Develocity team to investigate these across hundreds of OSS projects. After opening the failed job, our engineers review the build validation script report to prioritize. How many cache misses were there? What was the relative impact on build execution time? The build validation report contains answers to all of these questions.
Once the issue has been identified, we contribute a fix back to the project to ensure its build stays in an optimal state. In fact, this is exactly how the regression in the Spring Framework build was discovered and fixed—an example we’ll explore below.
These jobs are publicly available on GitHub in the Develocity OSS Projects repository. To get detailed instructions on how to set this up for your own projects, see the below section: Automatically detecting build regressions regularly with CI.
Changes to the build can cause build-time regressions
“Sometimes you don’t notice build-cache regressions until it’s really bad. A developer might notice a 2-3x increase in build time, but when it incrementally goes up by 1.1-1.2x, it will go unnoticed.”
– Emmanuel Boudrant
It’s easy to accidentally make a change that introduces volatility into your build and causes build times to regress. Build times may increase back to where they were before, or worse, get longer. To avoid this, you need a CI job that runs regularly and alerts you if any changes are introduced that cause cacheable work units to re-execute. This ensures that if any work avoidance regressions are introduced, they’re detected quickly.
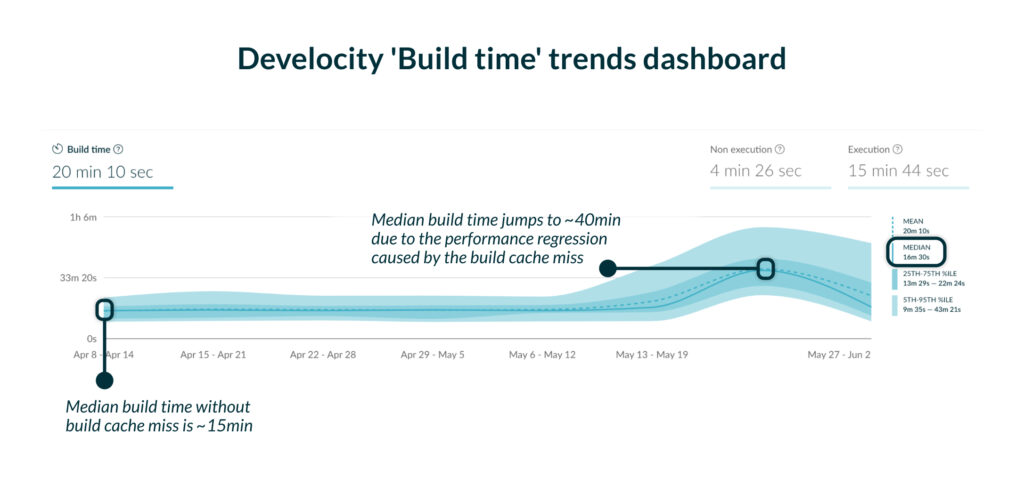
Even if you have a build time trends dashboard, it only allows you to identify increases in build times reactively. This means you can only detect build-time regressions after they’ve already happened. You need much more proactive and automated measures to stay on top of build performance.
Next, we’ll explore different strategies for ensuring builds are optimized and how both Netflix and Gradle do it at scale. You’ll learn how to be proactive about build time regressions and detect them before their impact is felt by your developers.
Note that throughout the article, we use the generic and inclusive term “work unit” rather than build-tool specific terminology like task (Gradle, sbt), goal (Maven), and target (Bazel).
Verifying build performance manually
One strategy to verify a build is optimized for work avoidance is to manually invoke it twice without making any changes between the two runs. If the build is fully optimized, then the second build will benefit from the work done by the first and avoid running any of its work units.
As a result, the second build finishes much more quickly. Granted, it’s not typical to run builds back-to-back without making any changes, but this represents the best-case build scenario that should result in a build where all work was avoided.
Here is one experiment you can perform right now in your build to verify that it can optimally leverage the local build cache. It doesn’t require any extra tooling and should work for most build tools:
- Ensure build caching is enabled
- Purge the local build cache
- Run the typical clean build command (e.g.
./gradlew clean buildor./mvnw clean verify) - Run the typical clean build command again
In this experiment, the first build will run and populate a fresh local build cache. Given a fully optimized build, the second build will then avoid running any cacheable work units, pulling all required outputs from the build cache instead. If the build is publishing Build Scan reports, we can look at the Build Scan of the second build to see if any cacheable work units were re-executed.
https://ge.solutions-team.gradle.com/s/jg3lgqa4tkm2g/performance/execution#cacheable
What happens in the second build when you run this experiment? If you had cacheable work units that re-executed, it means there’s volatility somewhere in your build, causing this non-deterministic behavior. From here, we can continue our investigation using the Timeline to see which work units re-executed and perform a Build Scan comparison to see the input differences between the builds. However, this is not something we will explore further in this post.
While it works to verify build performance manually, it can be easy to forget a step, like purging the build cache or running the build from a clean state. On top of that, different steps are required for each build tool and for other forms of work avoidance, like incremental building or remote build caching.
Builds are changing all the time. Dependency, plugin, and extension upgrades can occur daily. In order to stay on top of build performance and quickly detect any regressions, you need to verify builds frequently. However, you may have dozens or even hundreds of projects at your organization. Running at scale for many projects can quickly become a full-time job.
Verifying build performance using the Develocity Build Validation Scripts
The Develocity Build Validation Scripts completely automate the process of verifying your build is in an optimal state in terms of maximizing work avoidance. They are compatible with both Maven and Gradle builds, and in addition to addressing the limitations of the manual method described earlier, they:
- Provide a summary at the end of each experiment, making it easier to interpret the results than when using the manual method
- Support running the experiments against builds not yet connected to Develocity by injecting your Develocity configuration
- Can be run in an optional interactive mode that guides you through each step of the experiment
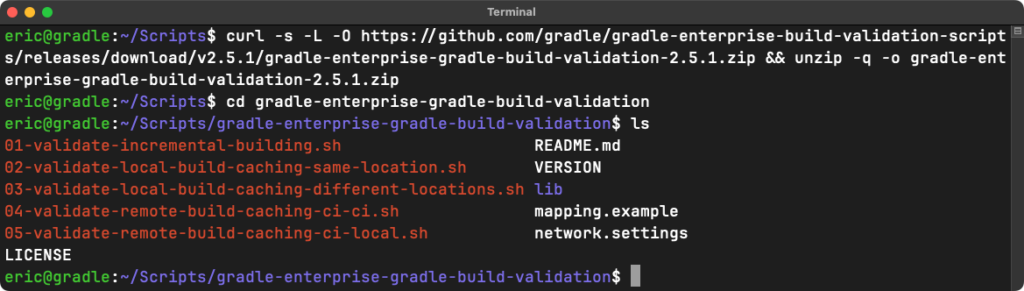
Installation instructions are available on GitHub for both Maven and Gradle. We recommend installing the scripts to a directory outside of your project’s working directory. What you see after installation depends on which version you install. For example, here is what you can expect to see after installing the scripts for Gradle:
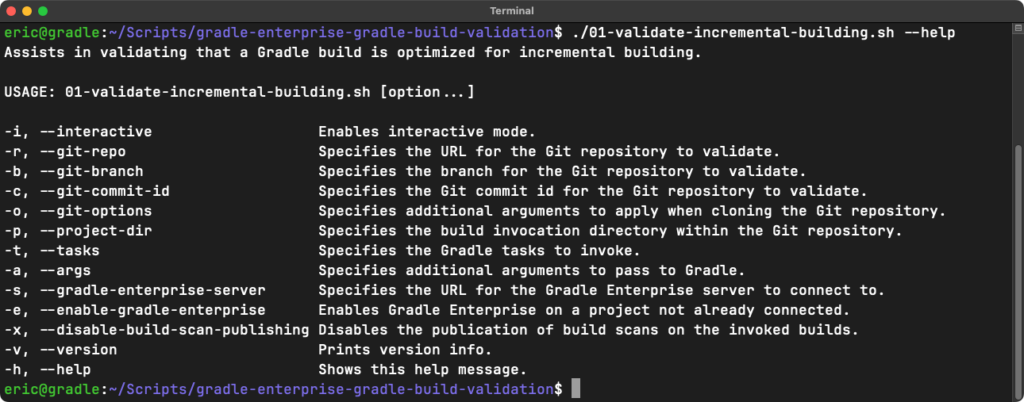
Each script can be invoked with the --help command to get more information about a given experiment and to see all available script options.
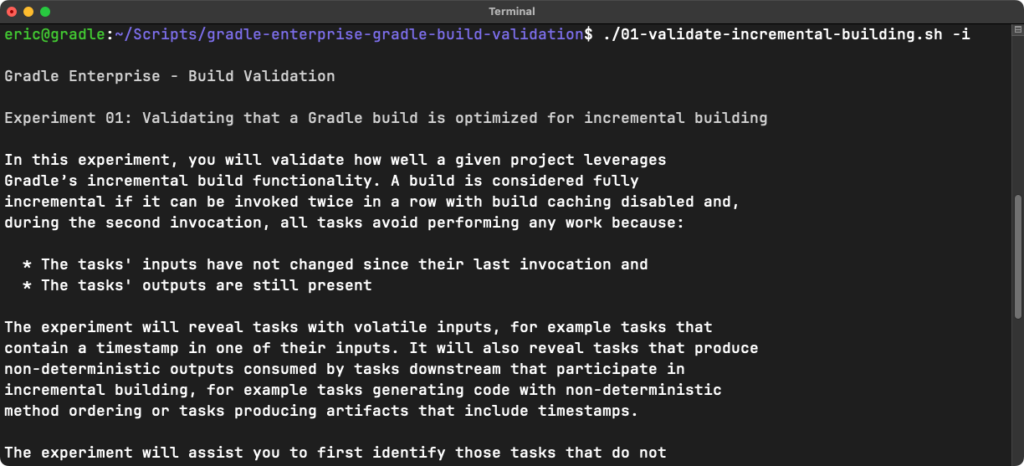
The experiments can also be run in an interactive mode using the -i / --interactive option. This is particularly useful for new users as it will walk you through every option and each step of the experiment. We recommend using interactive mode until you are familiar with each experiment and the process of validating your builds.
You can also run each experiment non-interactively. At a minimum, you must specify the location of the Git repository for the scripts to clone and the work units to invoke:
./01-validate-incremental-building.sh \
  --git-repo https://github.com/my-organization/my-project \
  --tasks    build
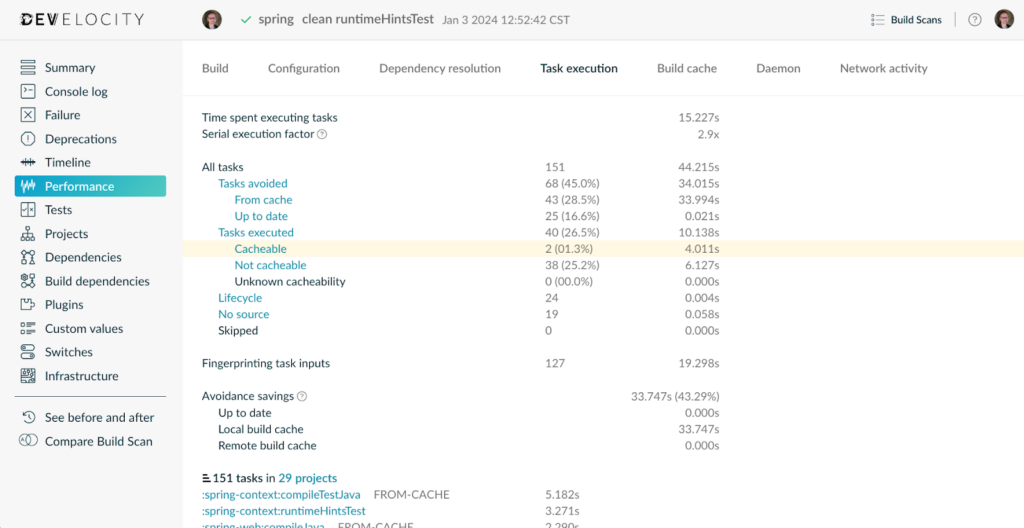
Let’s see a real example of the third experiment. The third experiment will help us validate that our build is optimally leveraging the local build cache when run from different locations on the same machine. It runs through a similar set of steps as the ones described in the previous section, with the difference being that it invokes the second build from a different directory. This will help us identify volatile inputs as a result of absolute paths. We will use the Spring Framework as the project to run the experiment against:
./03-validate-local-build-caching-different-locations.sh \
  --git-repo      https://github.com/spring-projects/spring-framework \
  --tasks         runtimeHintsTest \
  --git-commit-id ac11b03cd3c37121232d0b556fe642103179cdc9 \
  -s              https://ge.solutions-team.gradle.com
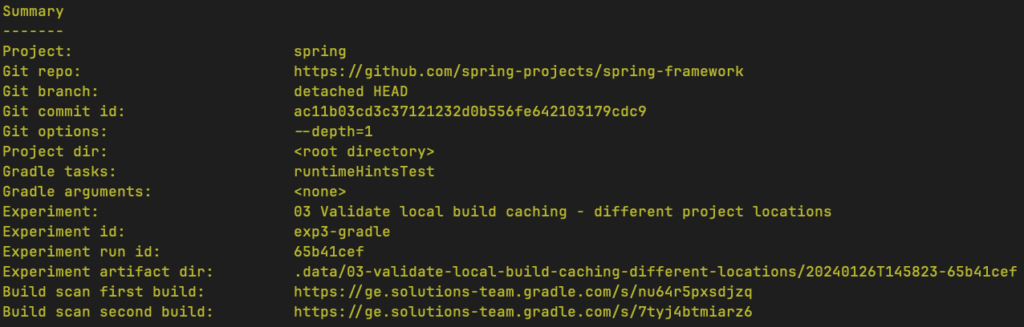
In addition to specifying the Git repository and task, we also specify the Git commit ID and Develocity server we want to use during the experiment. If you were to invoke this script with the same parameters, but replace https://ge.solutions-team.gradle.com with your Develocity server, you will eventually see the experiment summary, showing the results of the experiment. The experiment summary is broken up into three sections: Summary, Performance Characteristics, and Investigation Quick Links.
The ‘Summary’ section shows general information about the experiment, such as:
- The options that were used to configure it
- The path to a directory where you can inspect the project state
- The two published Build Scan links
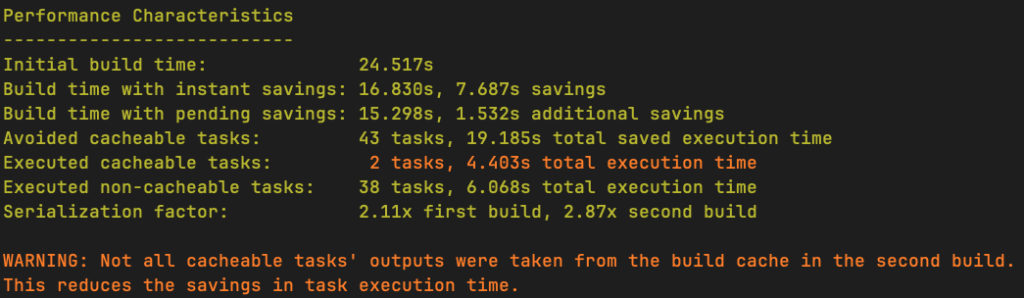
The ‘Performance Characteristics’ section describes different aspects of the performance of your build. In this case, we had two tasks in the second build that re-executed instead of having their outputs taken from the cache. The scripts do not modify anything about the project between the two builds, yet some tasks from the second build have been re-executed. This is a sign of volatile inputs.
The ‘Investigation Quick Links’ section provides us with several Develocity links, allowing us to further investigate the experiment results. For example, we can view: the Task execution overview to see a detailed breakdown of all task outcomes, the Executed cacheable tasks to see which tasks re-executed, and the Task inputs comparison to see the differences between the two build invocations.
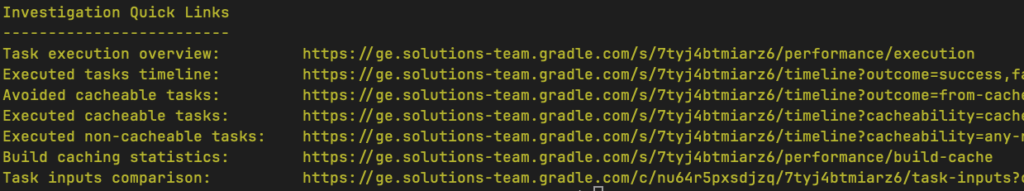
In this case, we can view the ‘Task inputs comparison’ to see if there was a difference in the jvmArgs used to invoke the tests. We now have what we need to investigate the cause of the volatility in the build. The best part about using the Build Validation Scripts is that they don’t require any interaction once they are invoked. This allows me to move on to other tasks or grab a water refill while they do the work of verifying my build.
Automatically detecting build regressions regularly in CI
Most CI providers, such as Jenkins, TeamCity, and GitHub Actions, allow jobs to be triggered on a regular and recurring basis. We can leverage this to make the Build Validation Scripts run automatically for our projects at a set time every week.
Below is a minimal example demonstrating how to run the Build Validation Scripts on Jenkins. It is configured to run the third Gradle experiment once every Sunday at some unspecified time. The key to making this work is the -f (or --fail-if-not-fully-cacheable) that’s included in the command to invoke the script. This will make the scripts return with a non-zero exit code if the build was not fully cacheable for the executed work units. It is standard for CI providers to treat a non-zero exit code as an error state, thus a non-fully cacheable build will result in a failed job.
def gitRepo = 'https://github.com/my-organization/my-project'
def tasks = 'build'

pipeline {
    agent any

    triggers {
        // Every Sunday at some unspecified time
        cron('H H * * 0')
    }

    stages {
        stage('Initialize Build Validation Scripts') {
            steps {
                script {
                    sh "curl -s -L -O https://github.com/gradle/gradle-enterprise-build-validation-scripts/releases/download/v2.5.1/gradle-enterprise-gradle-build-validation-2.5.1.zip && unzip -q -o gradle-enterprise-gradle-build-validation-2.5.1.zip"
                }
            }
        }

        stage('Run Build Validation Scripts') {
            steps {
                dir('gradle-enterprise-gradle-build-validation') {
                    sh "./03-validate-local-build-caching-different-locations.sh -r $gitRepo -t '$tasks' -f"
                }
            }
        }
    }
}
This alone is a great starting point for staying on top of build performance. It would be straightforward to adapt this job to run Gradle experiments 1, 2, & 3 or Maven experiments 1 & 2. You could even modify it to send a Slack notification to alert your team of the build regression, like Netflix does. The next step would be to roll this job out to other projects and put a process in place for triaging regressions. This ensures that builds remain in a fully optimal state at scale.
Learn more about maintaining build performance
Maintaining efficient build times is crucial, especially as your projects grow and the number of projects increases. Regular checks on your build performance are akin to routine maintenance for any system—they help prevent issues before they start.
This not only keeps your development process smooth but also fosters a culture of continuous improvement within your team. Automating the process (such as using the Develocity Build Validation Scripts) and alerting the project team of build performance regressions is a must.
Take the quick, self-guided product tour to see Develocity in action, or contact us to speak with an engineer about how Develocity can help you monitor build performance.
For more exciting content, follow us on X, LinkedIn, or subscribe to our YouTube channel.